There is a chart from Jim Cramer called “Cyclical Investing and Trading”, it draws GDP growth as a wave, and along the wave it tells you what to buy and what to sell at each step of the Fed (first easing, second easing, begins to tighten and so on), banks here, housing there, metals near the top, medicine and supermarket stocks on the way down. It looks very convincing, every label sits at a nice place on the curve, and this is exactly the kind of picture I do not want to trust before I test it.
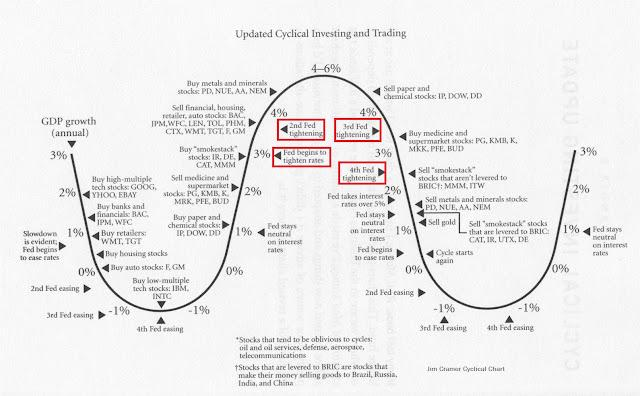
Chart: “Cyclical Investing and Trading” by Jim Cramer
So I tested it with QuantConnect data, daily prices from September 1998 to July 2026, and the Fed funds target rate from FRED (DFEDTAR and DFEDTARU) to decide which step of the cycle we are in. The rule is simple, count the cuts and the hikes in a row (1st, 2nd, 3rd, 4th), and if the Fed does nothing for 182 days, call it “neutral”. Then for every group on the chart, I use the same tickers printed on it (PD here is Phelps Dodge, not PagerDuty), and ask one question, did this group beat SPY while the chart said hold it?
The short answer is, the chart is about half right. 27 of 59 hold windows beat SPY (46%), which is a coin flip, and following the whole chart after 2007 made +10.0% a year when SPY made +10.8%. Before 2007 it looks great (+18.9% a year against +5.8%), but that is the period the chart was drawn from, so of course it fits.
But two points on it still work, and these are what I want to write down.
1. Buy tech when the Fed starts cutting
The chart says buy high-multiple tech (GOOG, YHOO, EBAY) right when the Fed begins to ease, and low-multiple tech (IBM, INTC) a few cuts later. I hold both until the first hike, the chart gives no sell point for them, so this part is my own reading.
- High-multiple tech beat SPY in 5 of 5 easing cycles, the edge (group return per year minus SPY return per year) is +27.0% inside the window and −4.9% outside
- Against SPY, window by window: +497% (1998), +267% (2001), +40% (2007), +33% (2019), +69% (2024)
- IBM and INTC beat SPY in 4 of 5, +3.9% a year inside the window and −4.4% outside (the miss is 2019, it lost 50% against SPY)
I need to be honest here, the 1998 and 2001 numbers are the dot-com years with YHOO and EBAY, and GOOG was picked around 2007 when everybody already knew it won, so +27% is not a number to expect (not at all). What I take from it is the direction, it still worked in the three cycles after the chart was drawn, which the chart could not know about.
2. Buy retailers early in the cuts
The chart says buy retailers (WMT, TGT) soon after the first cut and sell around the second hike.
- Inside the window, +4.6% a year over SPY, outside the window, −2.8% a year
- 3 of 5 windows beat SPY: +39%, +20%, −2%, +66%, −10%
This one is weaker than tech, 3 of 5 is not much, but the difference between inside and outside the window is on the right side, and it is only two stocks, so I would say it mostly holds, not more than that.
When the Fed is hiking
I also looked at the hiking side alone, the “buy” calls on the chart are not good there, but the “sell” calls are better.
- Sell paper and chemical stocks late in the hikes: they lost to SPY in all 4 cycles (−40%, −28%, −50%, −17%)
- Sell auto stocks after the hikes get going: also lost in all 4 (−13%, −55%, −18%, −30%)
- Overall, 9 of 11 groups on the chart are behind SPY while the Fed is hiking
Only 4 hiking cycles in the data (1999, 2004, 2015, 2022), so I take it as a hint, not more.
What did not work
Just to be fair to the test, the rest is not good.
- Banks, housing and autos bought during the cuts, 2 of 9 windows after 2007, the 2007 one lost 62%, 14% and 80% against SPY (you can guess why)
- Heavy industry, metals and gold during the hikes are backwards, they did better outside the chart’s window than inside it
- Medicine and supermarket stocks as the late-cycle shelter, 3 of 9
And the sample is small, 5 cutting cycles and 4 hiking cycles in 28 years, no fees, no slippage, and where exactly each label sits on the curve is my judgement. So I would not call the two points a strategy yet, it is more like two lines of the picture that survived. 🤔
Next I want to check the tech one with a sector ETF instead of three hand-picked stocks (XLK or QQQ), because if it only works with GOOG in the basket then it is not the Fed, it is GOOG.